Troubleshooting issues or understanding your site’s behavior often begins with reviewing logs. Pivotlar provides easy access to key logs—such as NGINX error logs and WordPress logs—directly from your site’s dashboard.
Each WordPress site deployed in Pivotlar comes with an isolated system environment and its own set of logs. You can view logs in real-time, download them, or clear them from a centralized interface.
Accessing Site Logs #
- Go to your Pivotlar Dashboard
- Navigate to Sites from the sidebar.
- Click on your desired site to access its Site Details.
- Click Logs to open dropdown to view the available logs for you
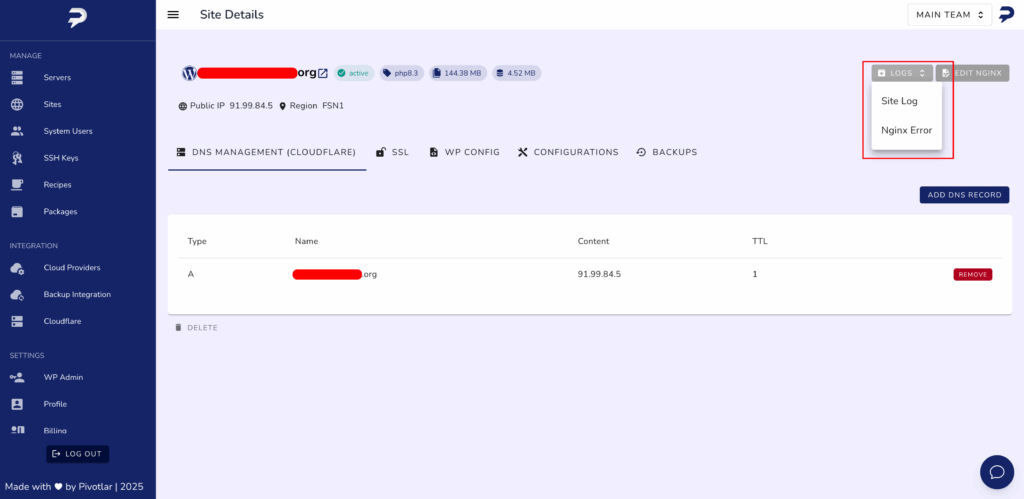
Available Logs #
For each site, Pivotlar supports viewing the following logs:
Site Deployment Log #
This log captures the full deployment process of your WordPress site. It’s your go-to resource when reviewing what actions were taken during setup or when debugging a failed deployment.
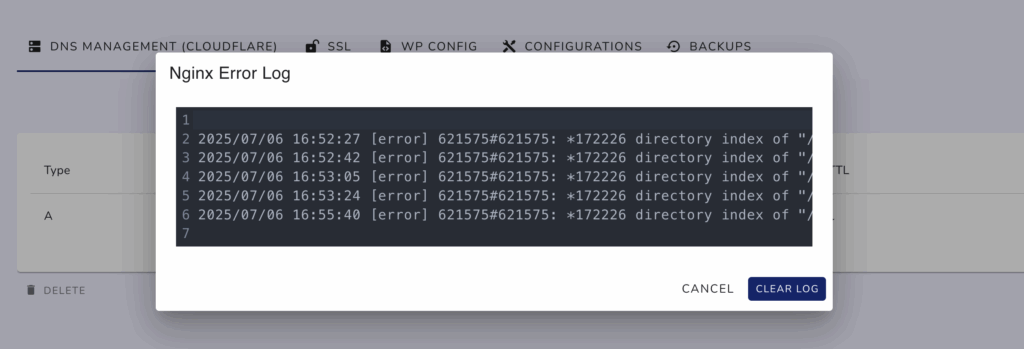
Nginx Access Log #
The Nginx Error Log in Pivotlar records all server-level issues encountered by the Nginx web server. These entries are crucial for diagnosing problems that prevent your website from functioning correctly or responding to requests.
This log typically includes:
- Misconfigured rewrite rules
- 404 Not Found errors not handled by WordPress
- PHP upstream issues (e.g.,
502 Bad Gateway) - Permission problems related to file or directory access
- SSL certificate failures
📍 All logs are scoped to the individual site you are viewing.
How to View Logs #
When you select a Nginx Error log from the list, a modal window will open displaying the full log content, including real-time entries, timestamps, and detailed error messages to assist with troubleshooting.
Understanding Log Entries #
Each log entry may contain:
- Timestamp – When the event occurred.
- Type – The severity or category (e.g., error, warning, notice).
- Description – Message content .
Need Help? #
Reach out to our support team via support@pivotlar.com


